4.2.2Activity Inference
How to Perform Activity Inference of TFs and Kinases
In this section, we leverage the differential analysis results to infer changes in the activity of kinases and transcription factors (TFs) following TGF-β stimulation. This approach is based on the assumption that the activity of TFs is reflected in the expression levels of their target genes, and kinase activity is mirrored by the phosphorylation status of their substrate proteins. With that, these downstream targets, namely genes and phosphosites, serve as molecular “footprints” of upstream regulatory activity, enabling the inference of activation or inhibition events in response to external stimuli.
4.2.2.1Load Packages
import os
import pandas as pd
import numpy as np
import decoupler as dc
import statsmodels.stats.multitest as smm4.2.2.2Load Data
We first load the results from the differential analysis conducted in the previous section.
rna_de = pd.read_csv('results/rna_de.csv', index_col='Feature')
phospho_de = pd.read_csv('results/phospho_de.csv', index_col='Feature')rna_de.head()phospho_de.head()4.2.2.3TF Activity Inference
For transcription factor (TF) activity inference, we use the TF regulon collection CollecTRI (Müller-Dott, 2023), which contains over 43,000 TF-gene interactions covering over 1,100 TFs and has been shown to outperform other regulon databases in identifying perturbed TFs based on gene expression.
Additionally, we employ the decoupler package (Badia-i-Mompel, 2022), which provides various enrichment methods, including a univariate linear model that was able to reliable identify perturbed TFs based on gene expression data.
collectri = dc.op.collectri(organism='human')For the activity inference, we use the t-values from the limma analysis, as they incorporate both the magnitude and statistical significance of change. Alternatively, other metrics such as log-fold change (logFC) can also be employed.
decoupler_input = rna_de[['t']].T

# run decoupler
TF_estimates, TF_pvals = dc.mt.ulm(data=decoupler_input, net=collectri)

# Format decoupler output
TF_score = TF_estimates.T.rename(columns={'t': 'score'})

TF_res = TF_score.join(TF_pvals.T).rename(columns={'t': 'pval'})
TF_res['adj.pval']=smm.multipletests(TF_res['pval'], method='fdr_bh')[1]
TF_res = TF_res.reset_index().rename(columns={"index": "source"})

# Print transcription factor activity scores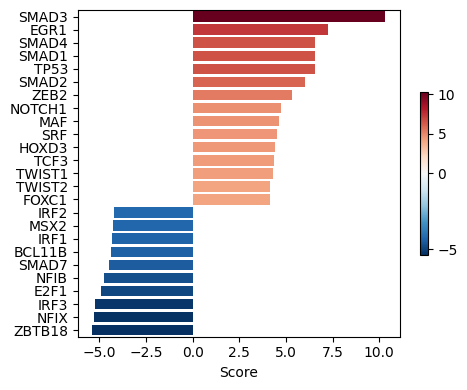
TF_res.head()We can then visualize the top 25 TFs ranked by activity scores. A positive score indicates increased activity following TGF-β stimulation, whereas a negative score reflects reduced activity.
dc.pl.barplot(
    data=TF_estimates,
    name='t',
    top=25,
    figsize=(5, 4)
)
4.2.2.4Kinase Activity Inference
Analogous to TF activity inference, we estimate kinase activities using phosphoproteomic data. This analysis integrates kinase-substrate annotations from PhosphoSitePlus, GPS Gold, and PTMsigDB, combined with the z-score–based approach implemented in RoKAI, which has shown strong performance in recent benchmarking studies (Müller-Dott, 2025). Alternative databases or enrichment methods could also be applied.
# Load kinase-substrate library
url = "https://zenodo.org/records/14824013/files/curated_library.csv?download=1"
kin_lib = pd.read_csv(url).rename(columns={'mor': 'weight'})
# Map phospho sites to kinases
name_df = phospho_de.index.to_series().str.extract(r'^([A-Z0-9]+).*_([A-Z]\d+)$')
phospho_de["phospho_site"] = name_df[0] + "_" + name_df[1]

phospho_de = phospho_de.set_index("phospho_site")
phospho_de = phospho_de[~phospho_de.index.duplicated(keep=False)]
# Infer kinase activity scores
kin_input = phospho_de[['t']].T
# run decoupler
kin_estimates, kin_pvals = dc.mt.ulm(data=kin_input, net=kin_lib)
# Format decoupler output
kin_score = kin_estimates.T.rename(columns={'t': 'score'})
kin_res = kin_score.join(kin_pvals.T).rename(columns={'t': 'pval'})
kin_res['adj.pval']=smm.multipletests(kin_res['pval'], method='fdr_bh')[1]
kin_res = kin_res.reset_index().rename(columns={"index": "source"})
# Print kinase activity scores
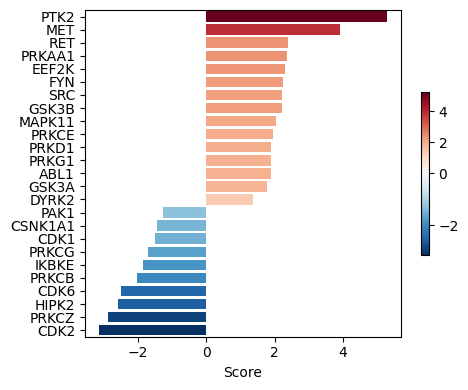
kin_res.head()We now visualize the top-ranked kinases based on their inferred activity scores.
# Plot results
dc.pl.barplot(
    data=kin_estimates,
    name='t',
    top=25,
    figsize=(5, 4)
)
4.2.2.5Save Data
The inferred TF and kinase activity profiles will be used in the next step to identify deregulated proteins which will then be integrated into a network model to explore how different regulatory layers interact and influence one another.
os.makedirs('results', exist_ok=True)

TF_res.to_csv('results/TF_act.csv', index=False)
kin_res.to_csv('results/kin_act.csv', index=False)- Müller-Dott, S., Tsirvouli, E., Vazquez, M., Ramirez Flores, R. O., Badia-i Mompel, P., Fallegger, R., Türei, D., Lægreid, A., & Saez-Rodriguez, J. (2023). Expanding the coverage of regulons from high-confidence prior knowledge for accurate estimation of transcription factor activities. Nucleic Acids Research, 51(20), 10934–10949. 10.1093/nar/gkad841
- Badia-i Mompel, P., Vélez Santiago, J., Braunger, J., Geiss, C., Dimitrov, D., Müller-Dott, S., Taus, P., Dugourd, A., Holland, C. H., Ramirez Flores, R. O., & Saez-Rodriguez, J. (2022). decoupleR: ensemble of computational methods to infer biological activities from omics data. Bioinformatics Advances, 2(1). 10.1093/bioadv/vbac016
- Müller-Dott, S., Jaehnig, E. J., Munchic, K. P., Jiang, W., Yaron-Barir, T. M., Savage, S. R., Garrido-Rodriguez, M., Johnson, J. L., Lussana, A., Petsalaki, E., Lei, J. T., Dugourd, A., Krug, K., Cantley, L. C., Mani, D. R., Zhang, B., & Saez-Rodriguez, J. (2025). Comprehensive evaluation of phosphoproteomic-based kinase activity inference. Nature Communications, 16(1). 10.1038/s41467-025-59779-y