1.2Prior Knowledge
How to load and interact with biological prior knowledge
1.2.1About
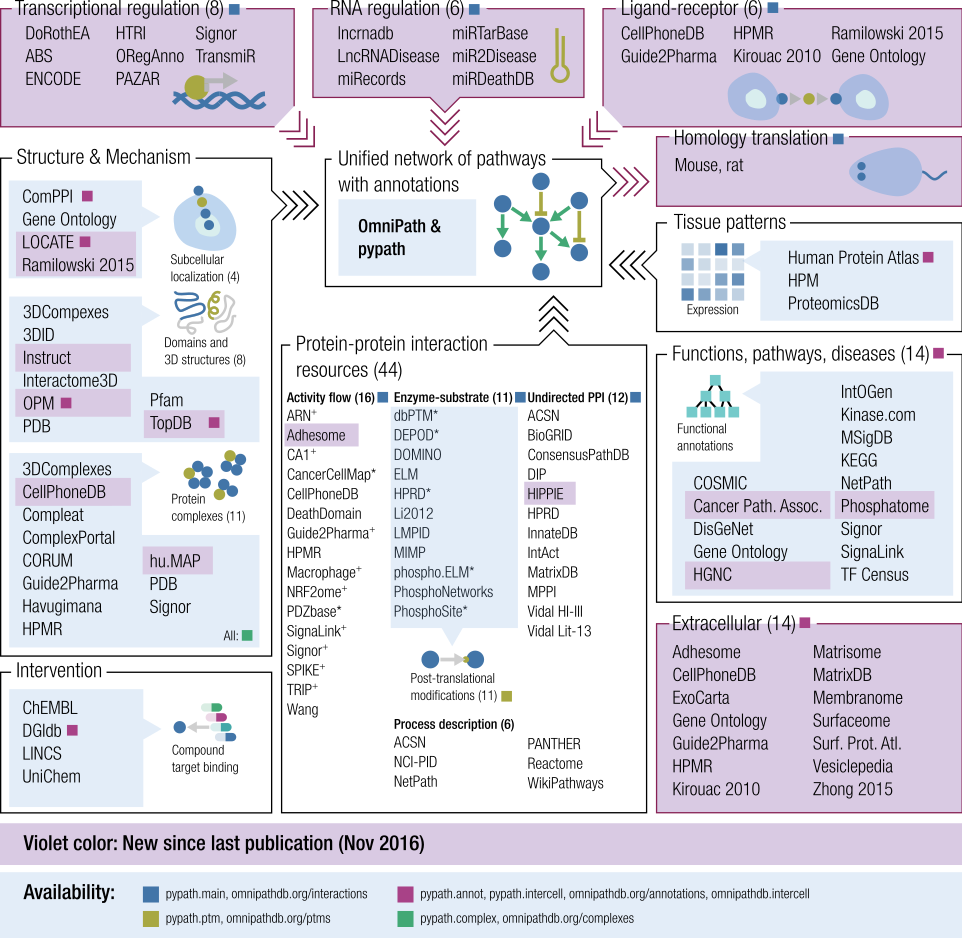
This notebook illustrates how to load and interact with different types of biological prior knowledge using OmniPath, via its Python interface. OmniPath is an integrated database of biological prior knowledge developed and maintained by the SaezLab. It provides a comprehensive collection of biological annotations and interactions.
Before running the notebook, make sure you have the following packages installed
! pip install git+https://github.com/saezlab/omnipath.git@afa15daf8385660131a8ecdfc44418912da770eb > /dev/null 2>&1We also import cached OmniPath tables
import omnipath as op
import gdown
import os
import zipfile

# Set the cache directory to a local, writable folder
os.environ["OMNIPATH_CACHE"] = "./.omnipath_cache"
op.options.cache = os.environ["OMNIPATH_CACHE"]

# Paths
zip_path = "omnipathdb.zip"
extracted_dir = ".omnipath_cache"  # or another folder you expect to contain extracted content

# Download ZIP only if not already present
if not os.path.exists(zip_path):
    print(f"⬇️  Downloading {zip_path}...")
    gdown.download(id='1_DCRUDN40fjblTRAuu0NpxUYMPZxDIkm', output=zip_path)
else:
    print(f"✅ {zip_path} already exists. Skipping download.")

# Unzip only if key contents are not extracted
if not os.path.exists(extracted_dir) or not os.listdir(extracted_dir):
    print(f"📦 Extracting {zip_path}...")
    with zipfile.ZipFile(zip_path, 'r') as zip_ref:
        zip_ref.extractall(extracted_dir)
else:
    print(f"✅ {extracted_dir} already populated. Skipping extraction.")
✅ omnipathdb.zip already exists. Skipping download.
✅ .omnipath_cache already populated. Skipping extraction.
Next, we load the libraries used in the tutorial
import pandas as pd
import numpy as np
import matplotlib.pyplot as plt
import itertools
import networkx as nx1.2.1.1Protein/Gene annotations
Gene-level annotations are the bread and butter of the functional analysis of omics data. These tables map individual genes/proteins to abstract, broader and biologically meaningful categories. In this example, we will retrieve tables containing protein subcellular localization, as defined by the Human Protein Atlas (HPA) database. We will also learn how to load UniProt protein families and the functional categories from SignaLink. As gene identifiers, we will uso HUGO symbols throughout the notebook. Check Bioregistry if you need to resolve your identifier and map them to HUGO symbols.
subcell_hpa = op.requests.Annotations.get(resources=['HPA_subcellular'], genesymbols=True, wide = True)
subcell_hpa[['genesymbol', 'location']].head(10)upfam = op.requests.Annotations.get(resources=['UniProt_family'], genesymbols=True, wide = True)
upfam[['genesymbol', 'family']].head(10)signalink = op.requests.Annotations.get(resources=['SignaLink_pathway'], genesymbols=True, wide = True)
signalink[['genesymbol', 'pathway']].head(10)The different sources of annotations can directly be queried using: op.requests.Annotations.params(), try it out!
Assuming we need a broad annotation of genes/proteins in our dataset, we can now merge the information from the three sources, which will generate a table that we can use in downstream analysis. For this example, we make a combined query to the three resources.
np.random.seed(42)
annot_df = op.requests.Annotations.get(resources=['HPA_subcellular', 'UniProt_family', 'SignaLink_pathway'], genesymbols=True, wide = False)
annot_df = annot_df[annot_df['label'].isin(['location', 'family', 'pathway'])].reset_index(drop=True)
annot_df['label'] = annot_df['label'].astype('str')
annot_df = annot_df.groupby(['genesymbol', 'label'])['value'].apply(lambda x: ', '.join(set(x))).reset_index()
annot_df = annot_df.pivot(index='genesymbol', columns='label', values='value').reset_index()
annot_df.sample(10)In addition to downstream enrichment analyses, we can use this table to retrieve information for a set of proteins of interest.
int_proteins = ['EGFR', 'MAPK1', 'BRAF']
annot_df[annot_df['genesymbol'].isin(int_proteins)]1.2.1.2Molecular interactions
While annotations provide information about the biological function of individual genes and proteins, molecular interactions provide information about how these genes/proteins interact with each other.
Here we will retrieve tables encoding molecular interactions between the same or different types of molecules, and containing different levels of information. Depending on the nature of the interactions and the type of problem we are working with, we may want to use different types of interactions.
We will load and explore the number of nodes and interactions in networks containing:
- Undirected interactions between proteins that form complexes. This is a specific type of Protein-Protein interaction (PPI) network, where the interactions represent the physical association of proteins in a complex. The data will be retrieved from CORUM.
- Directed signaling interactions between proteins from SIGNOR. This is a specific type of signaling network, where the interactions are directed and represent the flow of information in a signaling pathway. The data will be retrieved from SIGNOR.
- Directed interactions between kinases and target phosphorylation sites. This is a kinase-substrate interaction network, where the interactions are directed and represent the phosphorylation of specific amino acids in target proteins by kinases. Data will be retrieved from PhosphoSitePlus.
- Signed and directed interactions between transcription factors and their target genes. This is a specific type of transcriptional regulatory network, where the interactions are directed and signed, representing the activation or repression of target genes by transcription factors. Data is retrieved from CollecTRI.
1.2.1.2.1Complexes
corum = op.requests.Complexes.get(resources=['CORUM'])
corum.head(10)The information for complexes provides not only complex members, but also additional information such as stochiometry and supporting references for each interaction. To use it as input for the networkx package, we will need to convert it to a format that is compatible with the package.
def split_complex(members):
    splitted = members.split('_')
    combinations = itertools.combinations(splitted, 2)
    complex_df = pd.DataFrame(list(combinations), columns=['protein_a', 'protein_b'])
    return complex_df

split_complex('CHUK_IKBKB_IKBKG')splitted_corum = [ split_complex(m) for m in corum['components_genesymbols'] ]
splitted_corum = pd.concat(splitted_corum, ignore_index=True).reset_index(drop=True)
corum_network = nx.from_pandas_edgelist(splitted_corum, source='protein_a', target='protein_b')
print(corum_network)Graph with 3637 nodes and 39551 edges
1.2.1.2.2Directed signaling interactions
SIGNOR is a database of signaling interactions that provides information about the directionality of the interactions. This is important for understanding the flow of information in signaling pathways and for identifying potential drug targets. The data is retrieved from SIGNOR.
signor = op.interactions.AllInteractions.get(resources = ['SIGNOR'], genesymbols=True)
signor = nx.from_pandas_edgelist(signor[['source_genesymbol', 'target_genesymbol']].rename(columns={'source_genesymbol': 'source', 'target_genesymbol': 'target'}))1.2.1.2.3Kinase-substrate interactions
In contrast to complexes, kinase-substrate interactions are signed. We know which kinase (source) phosphorylates which substrate (target)
kinsub = op.requests.Enzsub.get(resources = ['PhosphoSite'], genesymbols=True)
kinsubkinsub_protein_net = nx.from_pandas_edgelist(kinsub, source='enzyme_genesymbol', target='substrate_genesymbol', create_using=nx.DiGraph())
def plot_neighborhood(graph, protein, regulon = False):
subgraph = graph.subgraph(nx.single_source_shortest_path_length(graph, protein, cutoff=1))
pos = nx.spring_layout(subgraph)
node_colors = ['orange' if node == protein else 'lightblue' for node in subgraph.nodes()]
# regulon information is importnat for signed edges, check later
if regulon:
edge_colors = ['red' if subgraph[u][v]['consensus_stimulation'] == 1 else 'blue' for u, v in subgraph.edges()]
else:
edge_colors = ['black' for u, v in subgraph.edges()]
plt.figure(figsize=(7, 7))
nx.draw_networkx(subgraph, pos, with_labels=True, node_size=250, node_color=node_colors, font_size=6, edgecolors=edge_colors)
plt.title(f'Neighborhood of {protein}')
plt.show()
np.random.seed(42)
plot_neighborhood(kinsub_protein_net, 'DYRK2')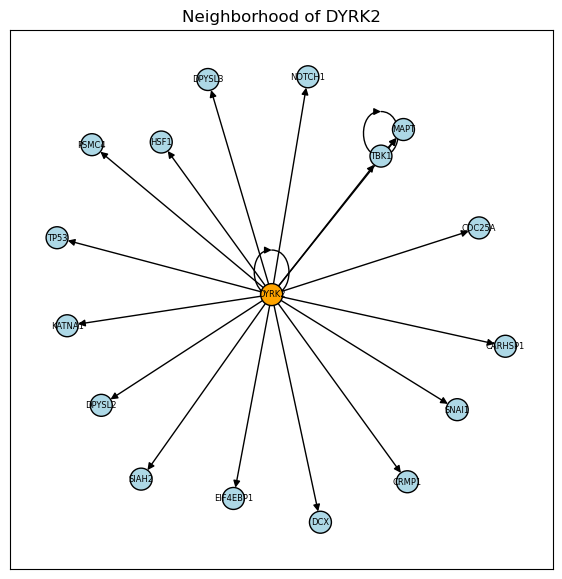
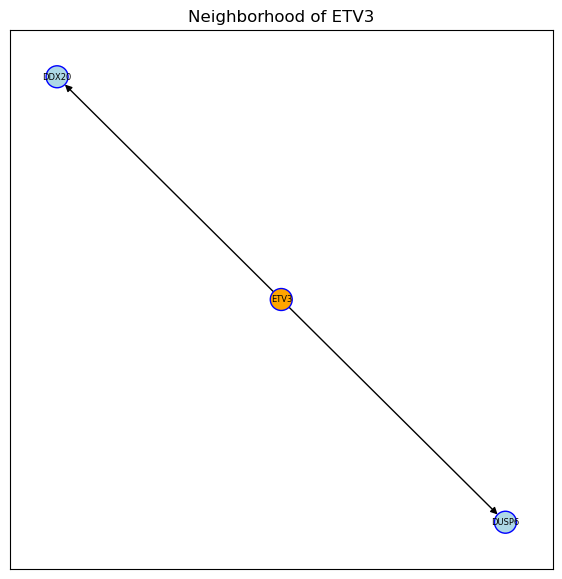
1.2.1.2.4Transcriptional regulatory interactions
In addition to sign, prior knowledge can also encode the sign of the interaction. It is typically used to indicate whether the interaction is activating or inhibiting. In this case, we will use the signed interactions from CollecTRI, which inform not only about which transcription factor regulates which gene, but also whether the interaction is activating or inhibiting.
tf_target = op.interactions.TFtarget.graph(genesymbols = True)
print(tf_target)
DiGraph with 14396 nodes and 59183 edges
np.random.seed(42)
plot_neighborhood(tf_target, 'ETV3', regulon=True)