1.3Footprint Analysis
How to perform kinase activity estimation
1.3.1About
This notebook illustrates how to perform kinase activity estimation from phosphoproteomics data using prior knowledge from OmniPath and various methods implemented in decoupleR. The tutorial uses data from this paper, which provides the most comprehensive phosphoproteomic characterization of the EGF signaling pathway to date.
First, we need to install and load the libraries used in this tutorial. We also retrieve the processed data tables.
! pip install git+https://github.com/saezlab/omnipath.git@afa15daf8385660131a8ecdfc44418912da770eb > /dev/null 2>&1
! pip install git+https://github.com/saezlab/decoupler-py.git@e679d325f1d4f2384ca2bdc6b48ffd5e59a8417a > /dev/null 2>&1
! pip install anndata > /dev/null 2>&1
import os
import gdown
import omnipath as op
# Set the cache directory
os.environ["OMNIPATH_CACHE"] = "./.omnipath_cache"
op.options.__setattr__('cache', os.environ["OMNIPATH_CACHE"])
# File paths
db_zip = "omnipathdb.zip"
egf_csv = "egf_data.csv"
# Download the database ZIP if not present
if not os.path.exists(db_zip):
gdown.download(id='1_DCRUDN40fjblTRAuu0NpxUYMPZxDIkm', output=db_zip)
os.system(f'unzip -o {db_zip}')
# Download the data CSV if not present
if not os.path.exists(egf_csv):
gdown.download(id='1wy6J1qKI7B6JehexS9-DaKjfxuievydk', output=egf_csv)import seaborn as sns
import matplotlib.pyplot as plt
import pandas as pd
import numpy as np
import decoupler as dcNext, we prepare the prior knowledge. For the tutorial, we will use Kinase-Substrate interactions. Specifically, we will retrieve kinase-phosphosite interactions curated in PhosphoSitePlus using OmniPath.
kinsub = op.requests.Enzsub.get(resources = ['PhosphoSite'], genesymbols=True)
kinsubWe also need to retrieve the input omics data. In this exercise, we use data from an experiment where HEK293F cells were treated with 0.1 µM Epidermal Growth Factor (EGF) for 0, 1, 3, 7, and 15 minutes. To stop signaling, the cells were flash-frozen at each time point. Proteins were extracted and enriched using Immobilized Metal Affinity Chromatography (IMAC), producing samples at the phosphopeptide level. These samples were then analyzed through Tandem Mass Tag (TMT) Data-Dependent Acquisition mass spectrometry. The raw spectral data were processed using FragPipe. The table shown here summarizes the results of a differential abundance analysis at the phosphosite level, comparing the 1-minute treatment to the untreated control, and includes log fold change (logFC), average abundance, P-value, and adjusted P-value for each site.
data = pd.read_csv('egf_data.csv')
data = data[['site_id', 'logFC', 'AveExpr', 't', 'P.Value', 'adj.P.Val']]
dataWe can make a volcano plot to get a quick overview of the distribution of sites across the magnitude (logFC) and significance (-log10 Adjusted P-value) axes.
data['significance'] = -np.log10(data['adj.P.Val'])
sns.scatterplot(data = data, x = 'logFC', y ='significance')
<Axes: xlabel='logFC', ylabel='significance'>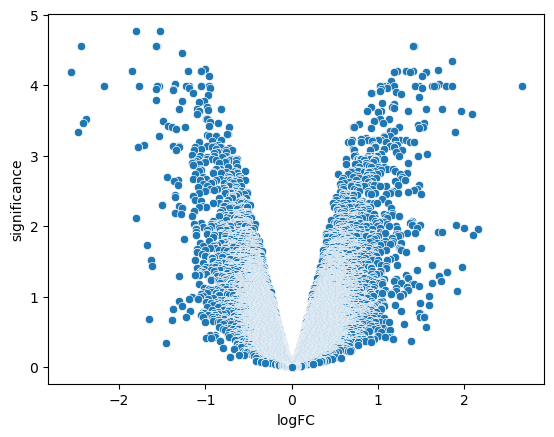
And also have a look to the top hits in a table format
data.sort_values('adj.P.Val').head(100)Once both the data and prior knowledge are prepared, we can format them as needed to perform the footprint analysis. On the knowledge side, decoupler requires a data frame with at least three columns: one for the source of the interaction (kinase), one for the target of the interaction (phosphosite), and one for the weight, which reflects the strength (and, when available, the sign) of the interaction.
kinsub_dc = kinsub.copy()
kinsub_dc['source'] = kinsub_dc['enzyme_genesymbol']
kinsub_dc['target'] = kinsub_dc['substrate_genesymbol'] + '_' + kinsub_dc['residue_type'].astype(str) + kinsub_dc['residue_offset'].astype(str)
kinsub_dc['weight'] = 1
kinsub_dc =  kinsub_dc[['source', 'target', 'weight']]
kinsub_dcOn the data side, decoupleR expects a matrix with as many columns as features (in our case, phosphosites) and as many rows as samples/contrasts (in our case, a single one). The values within the matrix will be used the kinase activity inference. In this exercise, we will employ the logFC as input value to infer kinase activities, hence the kinases showing higuest deregulated scores will be those for which the phosphosites downstream of them present the most deregulated (and sign coordinated) changes.
data_dc = data.copy()
data_dc = data_dc[['site_id', 'logFC']].set_index('site_id').T
data_dcOnce all the data is properly formatted, we can run decoupler. In this tutorial, we use two of the simplest enrichment methods offered by decoupleR. First, the Univariate Linear Model method, which models gene expression for each transcription factor as the product of coefficients and the weights matrix; the resulting coefficients are interpreted as transcription factor activities. Second, we use the Gene Set Variation Analysis (GSVA) method, a non-parametric, unsupervised approach that relies on the Kolmogorov-Smirnov ranked statistic and is designed to be robust against noise and outliers in the data.
ulm_scores = dc.run_ulm(mat = data_dc, net = kinsub_dc)[0]
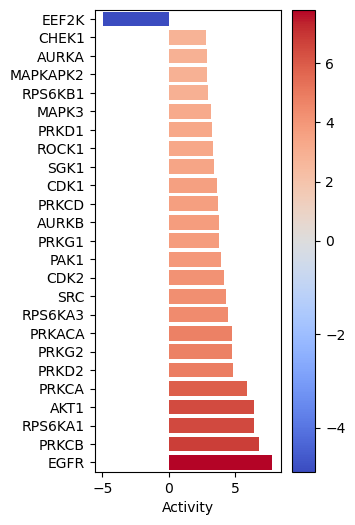
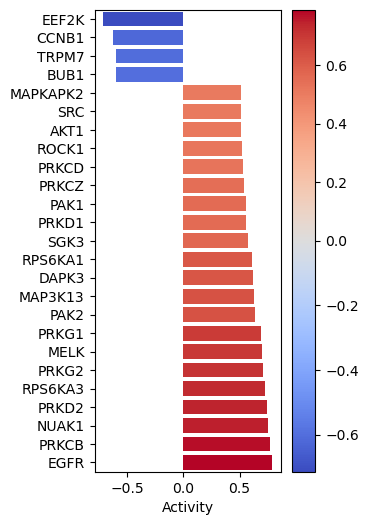
gsva_scores = dc.run_gsva(mat = data_dc, net = kinsub_dc)[0]After obtaining the results for both methods, we can visualize the top 25 deregulated kinases per method using a barplot. This will allow us to compare the results obtained from both methods and see if they are consistent.
dc.plot_barplot(
    acts=ulm_scores,
    contrast='logFC',
    top=25,
    vertical=True,
    figsize=(3, 6)
)
dc.plot_barplot(
    acts=gsva_scores,
    contrast='logFC',
    top=25,
    vertical=True,
    figsize=(3, 6)
)
- Garrido-Rodriguez, M., Potel, C., Burtscher, M. L., Becher, I., Rodriguez-Mier, P., Müller-Dott, S., Savitski, M. M., & Saez-Rodriguez, J. (2024). Evaluating signaling pathway inference from kinase-substrate interactions and phosphoproteomics data. 10.1101/2024.10.21.619348
- Hänzelmann, S., Castelo, R., & Guinney, J. (2013). GSVA: gene set variation analysis for microarray and RNA-Seq data. BMC Bioinformatics, 14(1). 10.1186/1471-2105-14-7